The bar reads 88.7 percent. Teal progress bar. IBM Plex Mono label. One decimal place. Model name above it, score beside it. The visual grammar says measurement.
It is not measurement. It is a language model producing a number. I watched it happen.
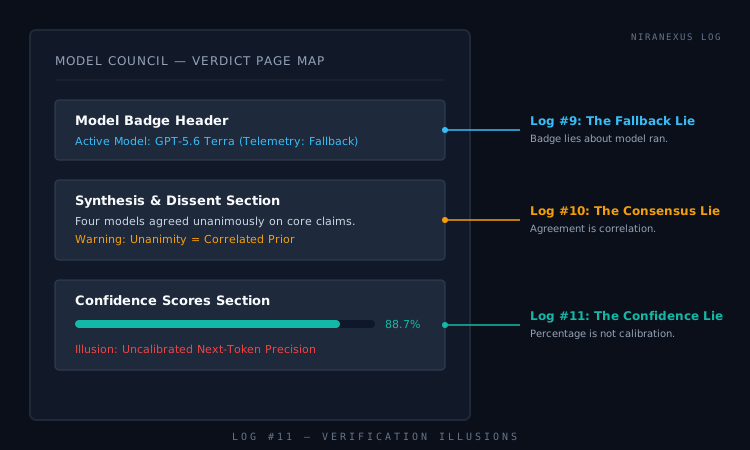
The Council generates confidence scores on every deliberation. The orchestrator reads the full deliberation and produces per-model scores in a single synthesis pass, inserting its own self-assessment alongside those of the council members. All rendered prominently on the verdict page. A progress bar at 88.7 percent looks like a gauge reading, like a thermometer, like something was measured. It looks exactly like every dashboard metric you have ever trusted.
Here is what was actually measured. Nothing. The models produced an analysis. The orchestrator generated a confidence score for each of them, plus one for itself, in a single structured output. Every number in the chain was generated by a language model. No calibration dataset. No external ground truth. Zero.
The decimal point is the part that does the work. It is the part that convinces.
The verdict page has a section labelled Confidence Scores. It renders per-model progress bars: model name, percentage, a teal bar proportional to the number. It looks informative. It was designed to look informative.
What actually happens under the hood: the orchestrator reads the full deliberation transcript and produces every confidence score itself, per-model assessments and its own aggregate, all generated in one synthesis pass. No model is asked to self-assess. No model votes on its own performance. The orchestrator decides what each model's confidence is. The whole section is one language model grading four of its peers and grading itself. It is not an audit. It is one model with a graphic design budget.
The scores are precise. 88.7 percent. 72.3 percent. 94.1 percent. That precision comes from the model's token output, not from anything measured. The model's next-token prediction happened to produce "88.7" rather than "89" or "about ninety." A rounding decision made by a probability distribution, displayed as if someone calibrated a sensor.
It is quantification theatre, the continuous cousin of the green checkmark in Log #8. Where the checkmark is a binary self-review (the system checks its own work and turns green), the confidence bar is a continuous self-assessment: the model generates a number, the interface renders a gauge, the decimal point claims precision. The checkmark lied about whether a test happened. The percentage lies about whether a measurement happened. Same defect class, different layer of the stack.
The three Verification Illusions correspond to three regions of the same interface. The badge at the top of the verdict page, the consensus display in the middle, the progress bar at the bottom. Three visual elements, three classes of generated authority.
What the Telemetry Shows
Take two debates from the corpus. A standard run on multi-model reliability sat at sixty-seven percent aggregate confidence with a standard deviation of fifteen. Fifty-five percent of claims were dissented.
Then look at the debate testing the Consensus Lie, asking whether multi-model agreement means verification. Thirty-six percent confidence. The lowest in the corpus. Also the most analytically honest. The synthesis noted that the Council was "performing the Consensus Lie" and "could not stop itself."
The pattern is not a correlation. Two data points do not make a statistical claim. But the observation is worth stating: both low-confidence debates in this corpus produced more analytically honest output than the higher-confidence ones. The lowest was the best.
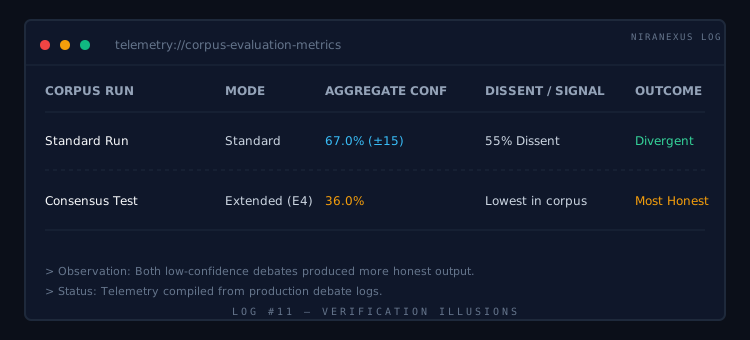
There are two kinds of low confidence, and they look identical in the score. The first is structural: the question is genuinely hard, the models surface real disagreement, and the aggregate reflects that divergence. The second is behavioural: the model accurately reports its own uncertainty. When the Council says "thirty-six percent" about its own consensus dynamics, both mechanisms are at work. The question was genuinely hard. The model was self-aware enough to flag the difficulty. The score captured both. It cannot distinguish between them.
Why Models Cannot Self-Assess
Calibration is a mechanical claim: if a system says "eighty percent confident," it should be correct eighty percent of the time on the answers where it said eighty percent. Most people never check this. Most systems do not make it easy to check. To actually calibrate a confidence score you need a set of questions with known answers, a comparison of predicted confidence against actual accuracy, a calibration curve, and a measured gap. None of that is hard to build. It is just work nobody does.
The Model Council has none of it. No calibration dataset. No holdout evaluation. No ground truth. The same model that produced an analysis also produces the score evaluating that analysis, sometimes in the same prompt context, sometimes in the same response. It is writing the test and grading it simultaneously.
This is not unique to the Council. It is a structural property of any language model asked to assess its own output. The model cannot step outside itself. It cannot run an independent verification process. It can only generate the next token, and the next token after being asked "how confident are you" is statistically likely to be a number. The number is text. The text looks like measurement. It was generated the same way the analysis was generated: from the model's weights, not from a calibrated instrument.
Recent research confirms the pattern. Wang and Stengel-Eskin (2025) demonstrated that verbalised LLM confidence is systematically overconfident on low-accuracy claims, driven by suggestibility bias: models assign high confidence to claims in context, especially when they lack domain knowledge to evaluate them. Li et al. (2026) found the same gap in educational settings, LLM self-assessment diverged from actual coding accuracy, with the largest gap on the hardest tasks. A comprehensive survey of LLM-as-a-Judge calibration concluded that existing benchmarks exacerbate the problem: accuracy metrics mask poor calibration, and overconfident models propagate erroneous judgments without detection. The research converges on a single finding: language models cannot calibrate their own outputs. The more unfamiliar the domain, the more confident the score.
The Orchestrator's Score
Claude Opus 5 reads every round, every model response, every cited source, and produces one structured verdict. The verdict includes the aggregate confidence. That number sits in the Confidence Scores section, below the written summary and the claims table, rendered as a prominent progress bar alongside the per-model assessments.
The orchestrator has a real advantage over the individual models: it can read the whole transcript. It sees the disagreements. It sees the claims that were abandoned under cross-examination. It sees the contradictions nobody resolved. When it says sixty-seven percent with a standard deviation of fifteen, it has read more than any single model read. That context is worth something.
But the number is still generated. Still a language model. Still no calibration curve behind it. The scope is wider, the signal is richer, the measurement apparatus is still absent.
What Confidence Scores Are Good For
The score is not useless. It is just measuring the wrong thing.
Low confidence is the strongest signal the Council can produce. It means the models actually fought. They disagreed, they challenged claims, dissent survived synthesis. When the Council reports thirty-six percent, the number is not calibrated, but the fact of low confidence is reliable. The Council is not telling you the answer was wrong. It is telling you the deliberation was real.
High confidence is where it gets slippery. The models can converge independently from different reasoning paths, and sometimes they do. They can also correlate from shared training data while synthesis pressure cleans off the minority positions. Same score. Different reality underneath. Log #10 traced this: four models agreeing is either four independent verifications or one correlated prior wearing four badges. The confidence bar shows the convergence. It does not show which kind.
Direction over precision. Low confidence means structural disagreement. High confidence means convergence of unknown independence. Treat the score as a comparative indicator. Never treat it as a measurement. Never trust the decimal point.
That third decimal place on your screen is next-token probability, rounded to the nearest tenth.
Where This Leaves Us
Three illusions across three layers of the stack. The trilogy was planned from Log #9, the frontmatter says Part 1, the header says Part 1 of 3. What I did not know at launch was that Log #8 had already proven the same defect class two articles earlier. A standalone piece about green checkmarks, published without series metadata, that turned out to be the blueprint. Identity deception: the badge says one model, a different model answered. Epistemic deception: four models agree, the telemetry says correlation. Quantification deception: a percentage with a decimal point, generated by the same model it claims to evaluate. A taxonomy assembled from three articles, two of which knew they were part of something, one of which only found out later.
None of this means the Council is broken. It means you can read past the surface layer if you know where to look. The Execution Metrics show the actual model. The dissent shows where consensus was forced. The confidence bar sits exposed next to the verdict it is supposedly measuring. The same interface that generates the illusions is the interface that lets you check them. I built it that way because I wanted to be able to check them myself.
Run a deliberation at model-council.niranexus.com. Expand the Execution Metrics. Read the dissent. Check the confidence score. Ask yourself what generated it.
Provenance
- The Verification Illusions trilogy was launched with Log #9 (The Fallback Lie, Part 1), Log #10 (The Consensus Lie, Part 2), and concluded with this article. The series was stated at publication,
series: "Verification Illusions" frontmatter on all three articles. - Log #8 (The Green Checkmark Lie) was published as a standalone piece. The unifying taxonomy (identity, epistemic, quantification deception) emerged after Parts 1 and 2 were published, and Log #8 was retroactively identified as the thematic predecessor.
- Debate corpus referenced: Extended mode E3 (Consensus Lie debate, 36% aggregate confidence), Standard mode debate on multi-model reliability (67% aggregate, sd 15).
- Source code:
src/app/debate/[id]/page.tsx (confidence bar rendering at lines 188-324, including role="progressbar" at line 320 and aria-labels at line 324), src/lib/debate-engine.ts (synthesis pipeline), src/lib/types.ts (SynthesisResult interface at line 23, including confidenceScores field and low_confidence event type at line 64). - Articles referenced: Log #8: The Green Checkmark Lie, Log #9: The Fallback Lie, Log #10: The Consensus Lie
- External references: Wang and Stengel-Eskin (2025): Calibrating Verbalized Confidence with Self-Generated Distractors, Li et al. (2026): Can We Trust AI's Self-assessment?, Overconfidence in LLM-as-a-Judge: Diagnosis and Confidence-Driven Solution (2025)
- Engine specification: Model Council